Callisto flybys groundtrack
Contents
Note
Click here to download the full example code
Callisto flybys groundtrack#
Example of representation of all the groundtrack during the Callisto flybys.
import matplotlib.pyplot as plt

from planetary_coverage import CALLISTO, TourConfig
Search all the Callisto flybys between 2032 and 2034#
[<SpacecraftFlyby> Observer: JUICE | Target: CALLISTO
 - Altitude at CA: 3,558.1 km
 - UTC at CA: 2032-06-21T00:38:12
 - Duration: 1 day, 0:00:00
 - Nb of pts: 2,041, <SpacecraftFlyby> Observer: JUICE | Target: CALLISTO
 - Altitude at CA: 1,132.1 km
 - UTC at CA: 2032-08-14T18:14:11
 - Duration: 1 day, 0:00:00
 - Nb of pts: 2,041, <SpacecraftFlyby> Observer: JUICE | Target: CALLISTO
 - Altitude at CA: 200.0 km
 - UTC at CA: 2032-09-10T19:24:58
 - Duration: 1 day, 0:00:00
 - Nb of pts: 2,041, <SpacecraftFlyby> Observer: JUICE | Target: CALLISTO
 - Altitude at CA: 200.0 km
 - UTC at CA: 2032-09-27T11:59:39
 - Duration: 1 day, 0:00:00
 - Nb of pts: 2,041, <SpacecraftFlyby> Observer: JUICE | Target: CALLISTO
 - Altitude at CA: 200.0 km
 - UTC at CA: 2032-11-16T13:16:14
 - Duration: 1 day, 0:00:00
 - Nb of pts: 2,041, <SpacecraftFlyby> Observer: JUICE | Target: CALLISTO
 - Altitude at CA: 1,218.5 km
 - UTC at CA: 2032-12-03T05:36:38
 - Duration: 1 day, 0:00:00
 - Nb of pts: 2,041, <SpacecraftFlyby> Observer: JUICE | Target: CALLISTO
 - Altitude at CA: 200.0 km
 - UTC at CA: 2033-06-04T18:38:03
 - Duration: 1 day, 0:00:00
 - Nb of pts: 2,041, <SpacecraftFlyby> Observer: JUICE | Target: CALLISTO
 - Altitude at CA: 200.0 km
 - UTC at CA: 2033-06-21T11:01:25
 - Duration: 1 day, 0:00:00
 - Nb of pts: 2,041, <SpacecraftFlyby> Observer: JUICE | Target: CALLISTO
 - Altitude at CA: 200.0 km
 - UTC at CA: 2033-08-10T12:13:50
 - Duration: 1 day, 0:00:00
 - Nb of pts: 2,041, <SpacecraftFlyby> Observer: JUICE | Target: CALLISTO
 - Altitude at CA: 316.1 km
 - UTC at CA: 2033-11-01T22:59:49
 - Duration: 1 day, 0:00:00
 - Nb of pts: 2,041, <SpacecraftFlyby> Observer: JUICE | Target: CALLISTO
 - Altitude at CA: 643.2 km
 - UTC at CA: 2034-02-15T00:07:45
 - Duration: 1 day, 0:00:00
 - Nb of pts: 2,041, <SpacecraftFlyby> Observer: JUICE | Target: CALLISTO
 - Altitude at CA: 3,073.6 km
 - UTC at CA: 2034-05-01T22:25:04
 - Duration: 1 day, 0:00:00
 - Nb of pts: 2,041, <SpacecraftFlyby> Observer: JUICE | Target: CALLISTO
 - Altitude at CA: 6,610.9 km
 - UTC at CA: 2034-06-24T05:14:32
 - Duration: 1 day, 0:00:00
 - Nb of pts: 2,041]
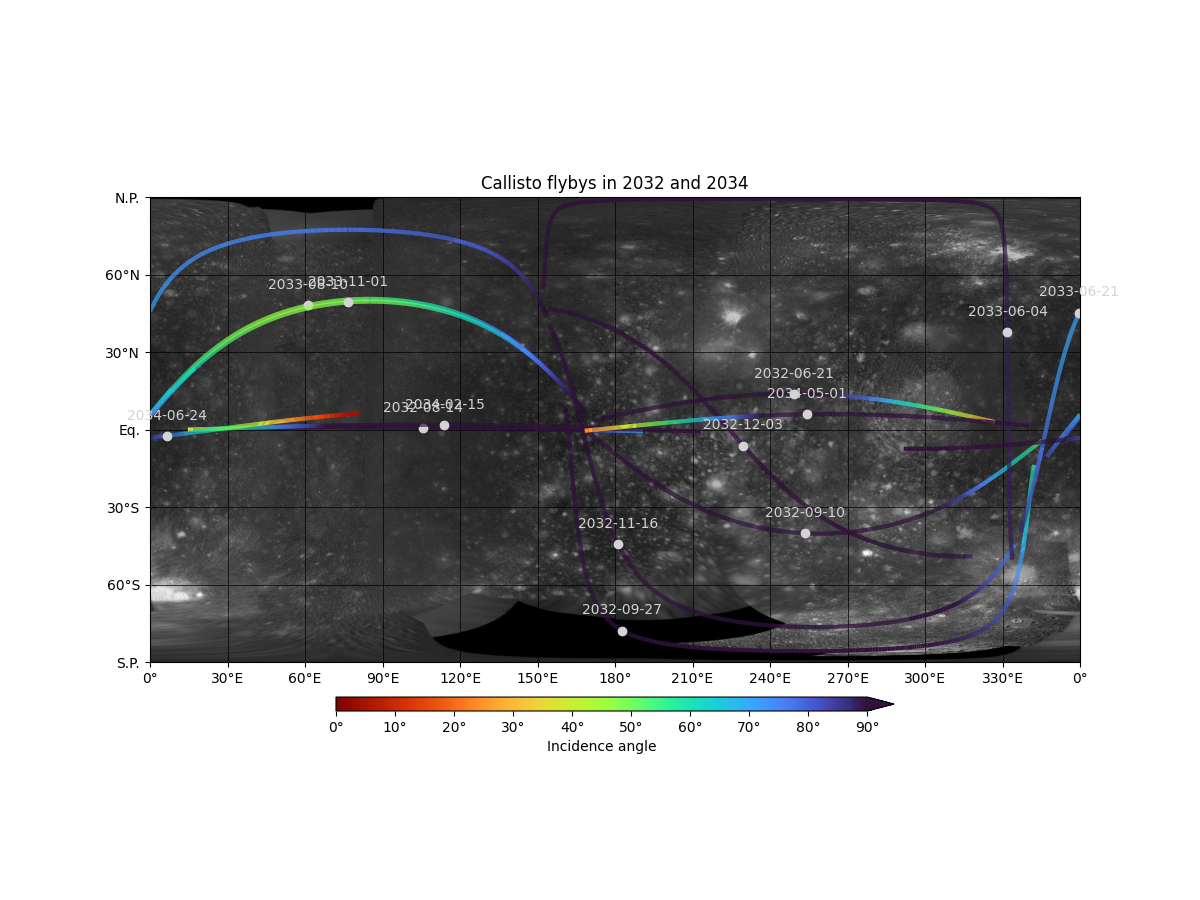
Represent the flybys on a map#
fig = plt.figure(figsize=(12, 9))
ax = fig.add_subplot(projection=CALLISTO)

for flyby in flybys:
    ax.plot(flyby.where(flyby.alt < 20_000), 'inc', lw=3, vmin=0, vmax=90, cbar=False)

    ax.plot(flyby.ca, 'o', color='lightgrey')
    ax.text(*flyby.ca.lonlat, f'{flyby.date_ca}\n',
            color='lightgrey', va='baseline', ha='center')

ax.colorbar(vmin=0, vmax=90, label='inc', extend='max')
ax.set_title('Callisto flybys in 2032 and 2034')

plt.show()
Download
Total running time of the script: ( 0 minutes 6.452 seconds)