Note
Click here to download the full example code
ESA BepiColombo#
Example of analysis of Earth flyby during BepiColombo cruise mission.
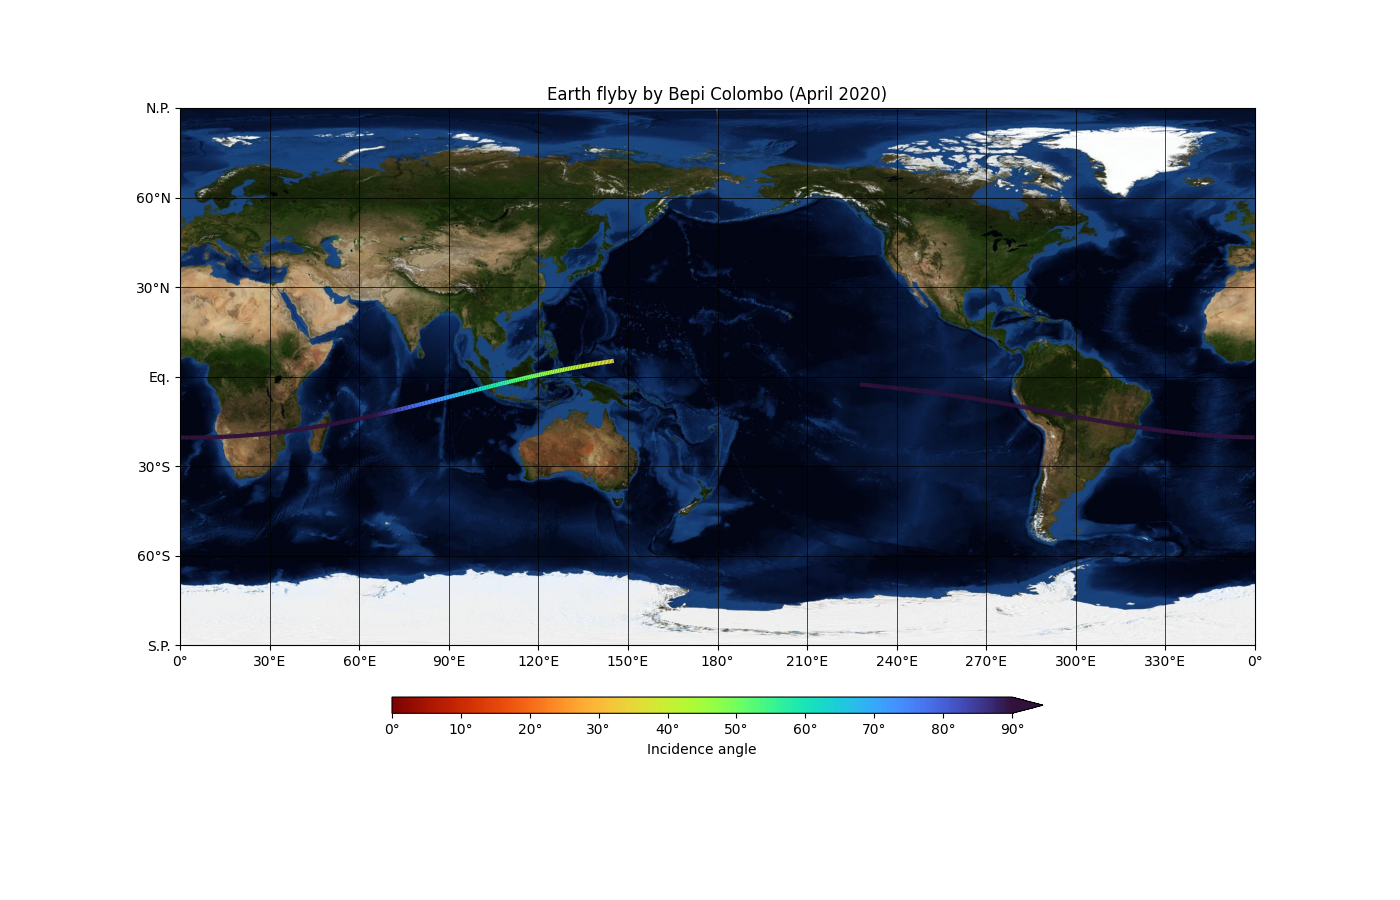
On its journey to Mercury, the BepiColombo spacecraft made a close flyby of the Earth in April 2020. In this example we will represent its ground track above the Earth surface.
import matplotlib.pyplot as plt

from planetary_coverage import EARTH, ESA_MK, TourConfig
from planetary_coverage.ticks import date_ticks, km_ticks
Get Bepi Colombo metakernel#
The BepiColombo mission is in operation since 2018 and its kernel set is already quite large and contains more than 400 versions:
BEPI_MK = ESA_MK['BEPICOLOMBO']

len(BEPI_MK.versions)
596
For the purpose of this example, we will use an old metakernel
generated in 2018 (v200_20181212_002) that contains less
kernels than the current version. Feel, free to change this value
by latest to use the latest version. Here is the list of
the available metakernels for this version:
BEPI_MK.version('v200_20181212_002')
['bc_plan.tm', 'bc_ops.tm']
Download the kernels and load the trajectory#
tour = TourConfig(
    mk='plan',
    version='v200_20181212_002',
    kernels_dir='./data/BEPICOLOMBO/kernels',
    download_kernels=True,
    spacecraft='BEPICOLOMBO MPO',
    target='Earth',
)

traj = tour['2020-04-10T00':'2020-04-10T06']

traj
<SpacecraftTrajectory> Observer: MERCURY PLANETARY ORBITER | Target: EARTH
 - UTC start time: 2020-04-10T00:00:00.000
 - UTC stop time: 2020-04-10T06:00:00.000
 - Nb of pts: 361
fig = plt.figure(figsize=(10, 7))
ax = fig.add_subplot()

ax.plot(traj.utc, traj.alt)

ax.set_ylabel('Altitude')
ax.xaxis.set_major_formatter(date_ticks)
ax.yaxis.set_major_formatter(km_ticks)

ax.set_title('Earth flyby by Bepi Colombo')

plt.show()
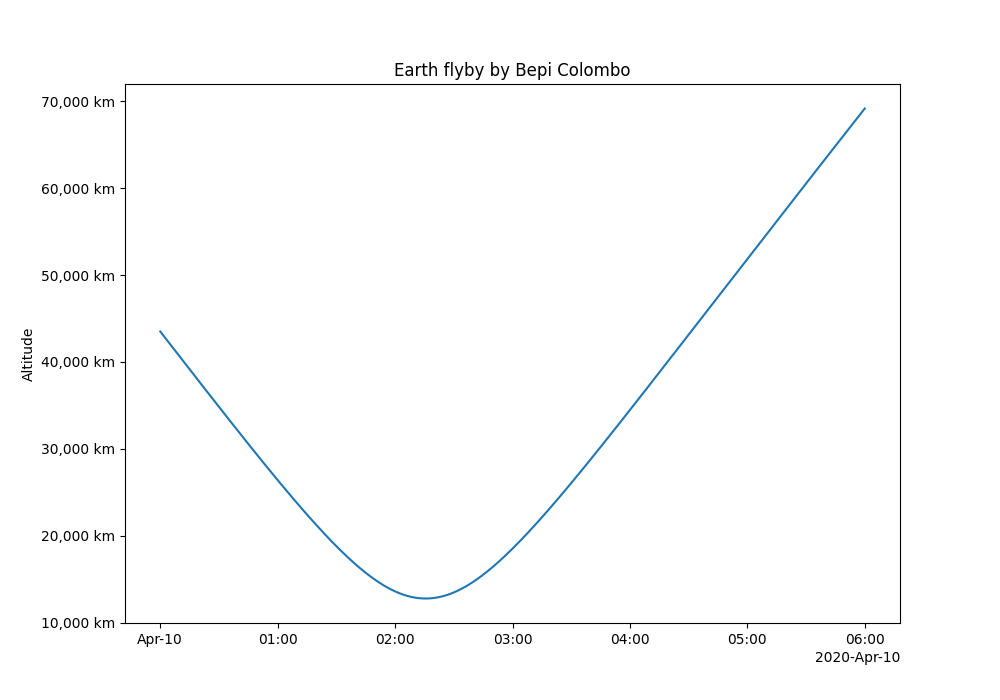
fig = plt.figure(figsize=(14, 9))
ax = fig.add_subplot(projection=EARTH)

ax.plot(traj, 'inc', vmin=0, vmax=90, lw=3)

ax.set_title('Earth flyby by Bepi Colombo (April 2020)')

plt.show()
Download
Total running time of the script: ( 0 minutes 11.069 seconds)