ROIs input formats#
Currently the planetary-coverage is able to load ROI from a .geojson, .kml and .kmz files.
Support for shape files (.shp) will also be considered in the future.
Geojson ROI#
Note
The current GeoJson supported types are FeatureCollection, Feature and Polygon.
To store and load complex ROI objects you can use GeoJson file (.geojson) to defined any polygonal shape (with single of multiple polygons, with ou without holes).
from planetary_coverage import GeoJsonROI

roi = GeoJsonROI('Galileo/SSI - C0368293000R', 'C0368293000R.geojson')

roi
<GeoJsonROI> Galileo/SSI - C0368293000R
 - Img Id: C0368293000R
 - Start Time: 1996-11-04T09:28:28
 - Main Target: CALLISTO
 - Ns: 800
 - Nl: 800
 - Filter: CLEAR
 - Expo Duration Ms: 29.17
 - Mean Res M: 1137.446
 - Res M Min: 1135.637
 - Res M Max: 1140.82
 - Inc Min: 31.093
 - Inc Max: 58.917
 - Emi Min: 6.318
 - Emi Max: 38.916
 - Phase Min: 52.489
 - Phase Max: 52.973
 - Offset L: 0
 - Offset S: 0
The properties of the geojson will be loaded as ROI properties:
roi.expo_duration_ms
29.17
Then you can represent this GeoJsonROI as any other ROI:
Note
A single GeoJsonROI can host multiple polygons with or without holes.
fig = plt.figure(figsize=(12, 6))
ax = fig.add_subplot(projection=CALLISTO)

ax.add_patch(roi);
KML/KMZ ROIs collection#
Google Earth .kml and .kmz files can be used to defined a collection of region of interest. They are usually defined as Point, LineString, LinearRing and Polygon inside XML Placemark tags.
Tip
You can import multiple .kml/.kmz at once if they have different folder names.
KmlROIsCollection(
  'rois_1.kml',
  'rois_2.kmz',
  target='Callisto'
)
from planetary_coverage import KmlROIsCollection

kml = KmlROIsCollection('callisto.kml', target='Callisto')

kml
<KmlROIsCollection> 1 roi | 1 category
You can explicitly list the ROIs in the file with:
kml.rois
<ROIsCollection> 1 roi
 - (1) Burr crater
You can select a single ROI with its key:
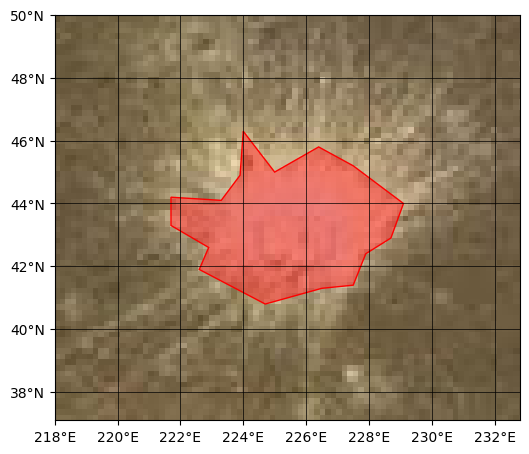
roi = kml['(1) Burr crater']

roi
<ROI> (1) Burr crater (Burr Crater)
 - Lons E: [227.9, 228.7, 229.1, 227.5, 226.4, 225.0, 224.0, 223.9, 223.3, 221.7, 221.7, 222.9, 222.6, 224.7, 226.5, 227.5]
 - Lats: [42.4, 42.9, 44.0, 45.2, 45.8, 45.0, 46.3, 44.9, 44.1, 44.2, 43.3, 42.6, 41.9, 40.8, 41.3, 41.4]
 - Description: Countour from Stephan et al. 2021 JUICE_ROI_CAL_5_0_04.
 - Edgecolor: #ff0000ff
 - Linewidth: 1
 - Facecolor: #ff202180
 - Geometry: LinearRing
 - Alts: [0.0, 0.0, 0.0, 0.0, 0.0, 0.0, 0.0, 0.0, 0.0, 0.0, 0.0, 0.0, 0.0, 0.0, 0.0, 0.0]
 - Category: Burr crater
 - Target: Callisto
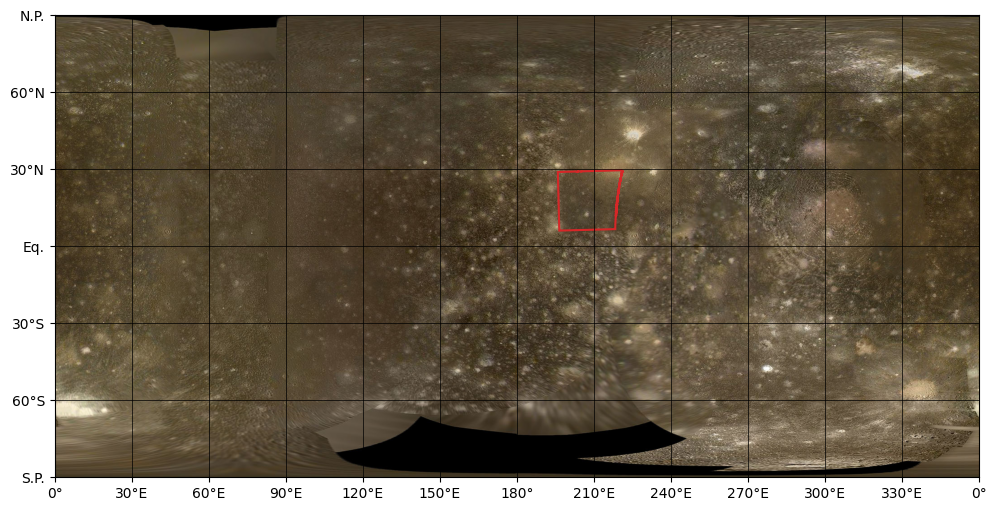
and display it on the map:
Note
You can display the whole KmlROIsCollection at once
with ax.add_collection(kml) instead of ax.add_patch(roi).
fig = plt.figure(figsize=(6, 6))
ax = fig.add_subplot(projection=CALLISTO)

ax.add_patch(roi)

ax.set_view(roi, margin=50);