Filtered Trajectory#
Single criteria filter#
Based on your criteria, you can select only a fraction of the Trajectory with the where() condition.
Then you will get a MaskedSpacecraftTrajectory object (or a MaskedInstrumentTrajectory for a InstrumentTrajectory) that contains only the selected portion of the trajectory. In the following example, the trajectory is split in 8 segments and only 548 points were kept out of the initial 1441.
sc_traj.where(sc_traj.alt > 500)
<MaskedSpacecraftTrajectory> Observer: JUICE | Target: GANYMEDE
 - First UTC start time: 2035-06-01T00:00:00.000
 - Last UTC stop time: 2035-06-02T00:00:00.000
 - Nb of pts: 514 (+927 masked)
 - Nb of segments: 9
Multi-criteria filter#
Some shortcuts, like day (inc <= 90°) and night (inc > 90°) are available and you can chain the conditions with & (and) and | (or) logical operators:
mask_traj = sc_traj.where((sc_traj.alt > 500) & sc_traj.day)

mask_traj
<MaskedSpacecraftTrajectory> Observer: JUICE | Target: GANYMEDE
 - First UTC start time: 2035-06-01T01:58:00.000
 - Last UTC stop time: 2035-06-02T00:00:00.000
 - Nb of pts: 293 (+1,148 masked)
 - Nb of segments: 8
Warning
When you are using mutli-criteria filters, you need to encapsulate non-boolean conditions with parenthesis (...) between the logical operators,
otherwise the & and | operators will be executed before the < or > operators.
For example, this syntax is incorrect:
sc_traj.where(sc_traj.alt > 500 & sc_traj.day)
Masked trajectory representation#
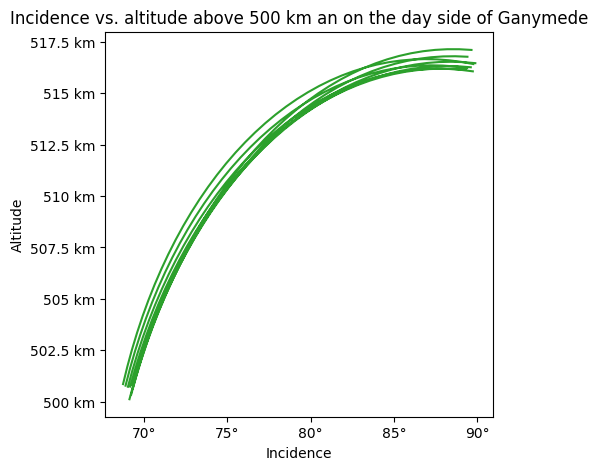
Here, we can represent the correlation between the altitude and the incidence on the masked trajectory:
fig = plt.figure(figsize=(5, 5))
ax = fig.add_subplot()

ax.plot(mask_traj.inc, mask_traj.alt, color='tab:green')

# Optional labels
ax.set_xlabel('Incidence')
ax.set_ylabel('Altitude')
ax.xaxis.set_major_formatter(deg_ticks)
ax.yaxis.set_major_formatter(km_ticks)

ax.set_title('Incidence vs. altitude above 500 km an on the day side of Ganymede');
Masked trajectory on a Map#
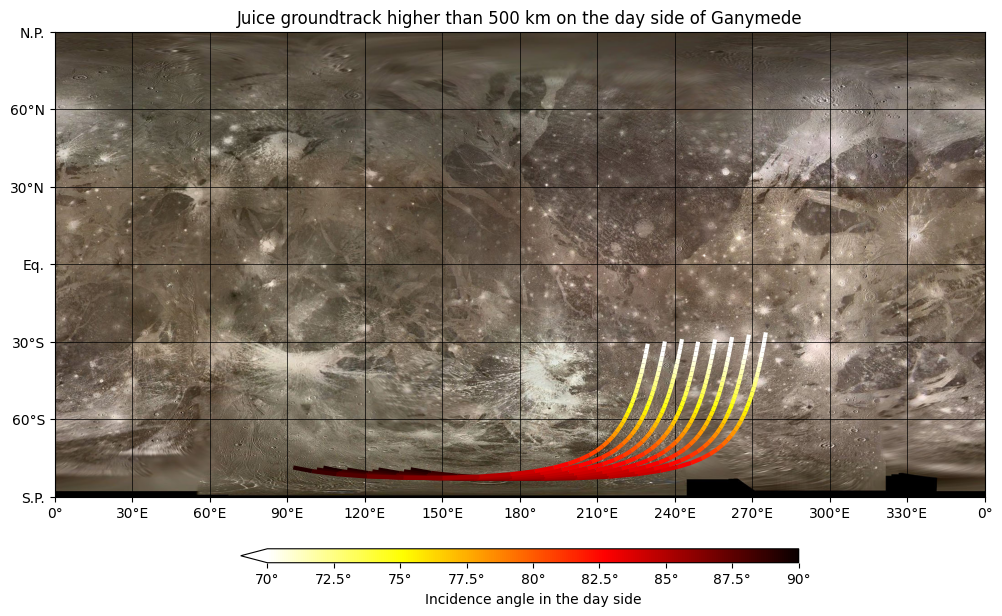
When reported on a basemap, only the valid data will be represented:
Tip
You can customize your plots by changing the color map (cmap) and its color extend (vmin and vmax).
If the data extends the defined color range, a pointing arrow will be displayed on the colorbar to show that some values were clipped.
Here, we also added a custom the colorbar label.
fig = plt.figure(figsize=(12, 9))
ax = fig.add_subplot(projection=GANYMEDE)

ax.plot(
  mask_traj, 'inc', linewidth=3,
  cmap='hot_r', vmin=70, vmax=90,
  label='Incidence angle in the day side'
)

ax.set_title('Juice groundtrack higher than 500 km on the day side of Ganymede');
Segmented trajectories#
When you have a MaskedTrajectory, most of the time, you will have multiple segment of valid trajectories.
If you need to extract these segments to perform some statistical analysis, you can perform a loop over the MaskedTrajectory and retrieve a list of SegmentedTrajectory which have the same properties as their parent:
for seg_traj in mask_traj:
  print(
    f'Start: {seg_traj.start} | Stop: {seg_traj.stop} | '
    f'Incidence: {seg_traj.inc.min():.2f}° <-> {seg_traj.inc.max():.2f}°'
  )
Start: 2035-06-01T01:58:00.000 | Stop: 2035-06-01T02:35:00.000 | Incidence: 68.73° <-> 89.77°
Start: 2035-06-01T05:02:00.000 | Stop: 2035-06-01T05:38:00.000 | Incidence: 68.88° <-> 89.40°
Start: 2035-06-01T08:06:00.000 | Stop: 2035-06-01T08:42:00.000 | Incidence: 69.03° <-> 89.74°
Start: 2035-06-01T11:10:00.000 | Stop: 2035-06-01T11:45:00.000 | Incidence: 69.16° <-> 89.32°
Start: 2035-06-01T14:14:00.000 | Stop: 2035-06-01T14:49:00.000 | Incidence: 69.29° <-> 89.62°
Start: 2035-06-01T17:17:00.000 | Stop: 2035-06-01T17:53:00.000 | Incidence: 69.12° <-> 89.89°
Start: 2035-06-01T20:21:00.000 | Stop: 2035-06-01T20:56:00.000 | Incidence: 69.22° <-> 89.41°
Start: 2035-06-01T23:25:00.000 | Stop: 2035-06-02T00:00:00.000 | Incidence: 69.31° <-> 89.66°
You can also export each segment as temporal windows to use them in the Juice Segment Harmonization Tool or in MAPPS. More details can be found here.
ROI intersection#
You can also filter a Trajectory by taking the points that are inside or outside a pre-defined region of interest (ROI). More details can be found here.