Note
Click here to download the full example code
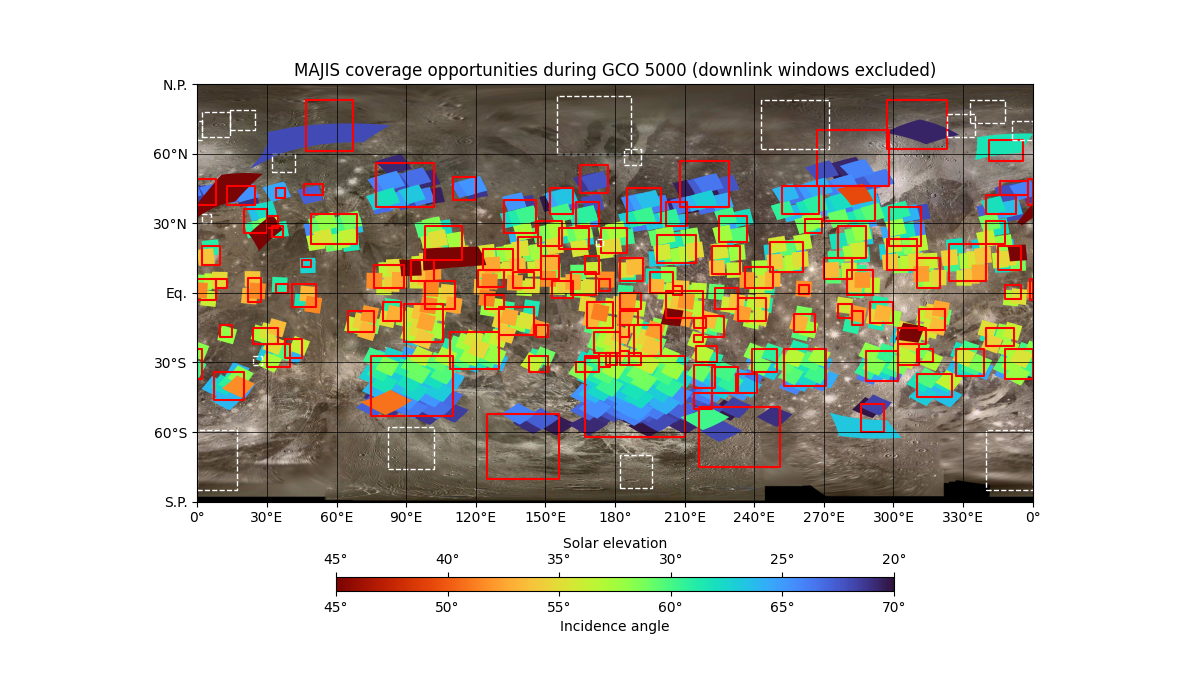
ROIs seen by MAJIS during GCO5000#
Example of opportunities for MAJIS to observe Ganymede ROIs during GCO5000 phase.
import matplotlib.pyplot as plt

from planetary_coverage import GANYMEDE, GanymedeROIs, TourConfig
from planetary_coverage.ticks import deg_ticks
Load Juice trajectory during GCO 5000#
tour = TourConfig(
    mk='5.1 150lb_23_1', version='v422_20230130_002',
    spacecraft='JUICE', instrument='MAJIS_ENVELOPE', target='Ganymede',
)

majis_gco_5000 = tour['GCO5000':'15 min']

majis_gco_5000
<InstrumentTrajectory> Observer: JUICE_MAJIS_ENVELOPE | Target: GANYMEDE
 - UTC start time: 2035-01-17T03:00:00.000
 - UTC stop time: 2035-04-16T16:00:00.000
 - Nb of pts: 8,598
Keep only the part of the trajectory well lighted#
traj = majis_gco_5000.where(majis_gco_5000.inc < 70)

traj
<MaskedInstrumentTrajectory> Observer: JUICE_MAJIS_ENVELOPE | Target: GANYMEDE
 - First UTC start time: 2035-01-17T03:00:00.000
 - Last UTC stop time: 2035-04-16T15:29:59.998
 - Nb of pts: 1,875 (+6,723 masked)
 - Nb of segments: 167
Find the ROIs intersected by the trajectory#
traj_in_rois = traj & GanymedeROIs

traj_in_rois
<MaskedInstrumentTrajectory> Observer: JUICE_MAJIS_ENVELOPE | Target: GANYMEDE
 - First UTC start time: 2035-01-17T03:30:00.000
 - Last UTC stop time: 2035-04-16T03:44:59.998
 - Nb of pts: 729 (+7,869 masked)
 - Nb of segments: 372
rois_visible = GanymedeROIs & traj
rois_not_visible = GanymedeROIs ^ traj

len(GanymedeROIs), len(rois_visible), len(rois_not_visible)
(139, 124, 15)
(
    f'{len(rois_visible) / len(GanymedeROIs):.0%} of Ganymede ROIs are '
    'visible with MAJIS with an incidence lower than 70° during GCO 5000.'
)
'89% of Ganymede ROIs are visible with MAJIS with an incidence lower than 70° during GCO 5000.'
Represent the intersection opportunities on the map#
fig = plt.figure(figsize=(12, 7))
ax = fig.add_subplot(projection=GANYMEDE)

ax.add_collection(traj_in_rois.fovs(facecolors='inc', vmin=45, vmax=70, sort='inc'))

ax.add_collection(rois_visible(edgecolors='red'))
ax.add_collection(rois_not_visible(edgecolors='white', linewidths=1, linestyles='--'))

ax.colorbar(vmin=45, vmax=70, label='inc')
ax.twin_colorbar(label='Solar elevation', format=90 - deg_ticks)
ax.set_title('MAJIS coverage opportunities during GCO 5000 (downlink windows excluded)')

plt.show()
Total running time of the script: ( 0 minutes 27.753 seconds)