Regions of Interest#
In order to study some particular area on a given planetary body, you can defined a collection of Regions Of Interest (ROI). You can create these objects manually with any polygonal shape based on the coordinates of each node, or, you can import them from predefined list of known ROIs (like the one defined by Stephan et al. 2021 or from any geojson file).
In all these cases, you can perform intersection calculation with any Trajectory objects to know if a trajectory cross a ROI, or, which ROI are crossed by a trajectory.
Example of a manually defined ROI#
from planetary_coverage import ROI

roi = ROI(
  'my-custom-roi',              # Primary key
  lons_e=[180, 150, 120, 150],  # Contour coordinates
  lats=[30, 50, 30, 10],
  name='My custom ROI',         # Additional metadata
  color='tab:green',
)
All the additional metadata can be accessed as properties on the ROI object:
roi.color
'tab:green'
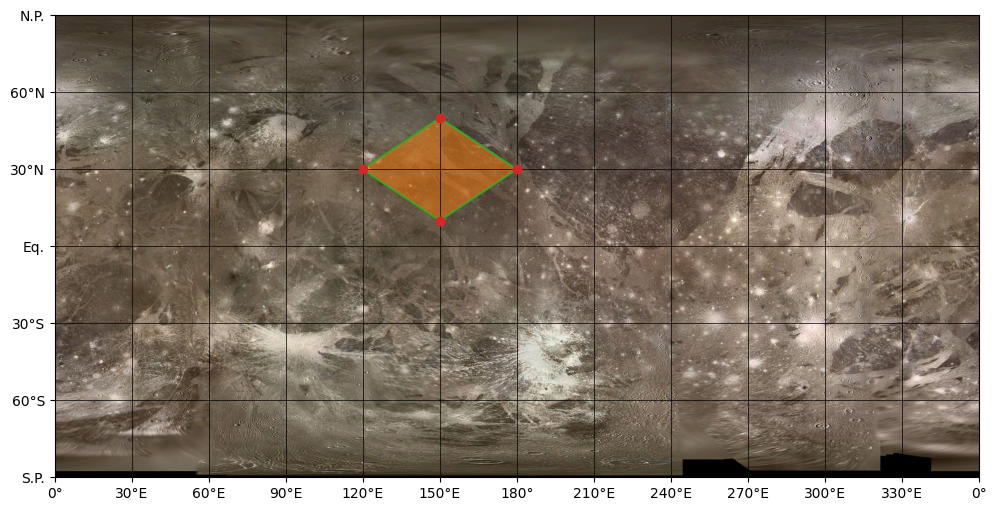
Represent a ROI on a Map#
fig = plt.figure(figsize=(12, 6))
ax = fig.add_subplot(projection=GANYMEDE)

# Plot red nodes only
ax.plot(roi.lons_e, roi.lats, 'o', color='tab:red')

# Draw the contour with default ROI color if present (green)
ax.add_patch(roi)

# Fill the polygon with a custom color (orange)
ax.add_patch(roi(facecolor='tab:orange', alpha=.5))