Note
Click here to download the full example code
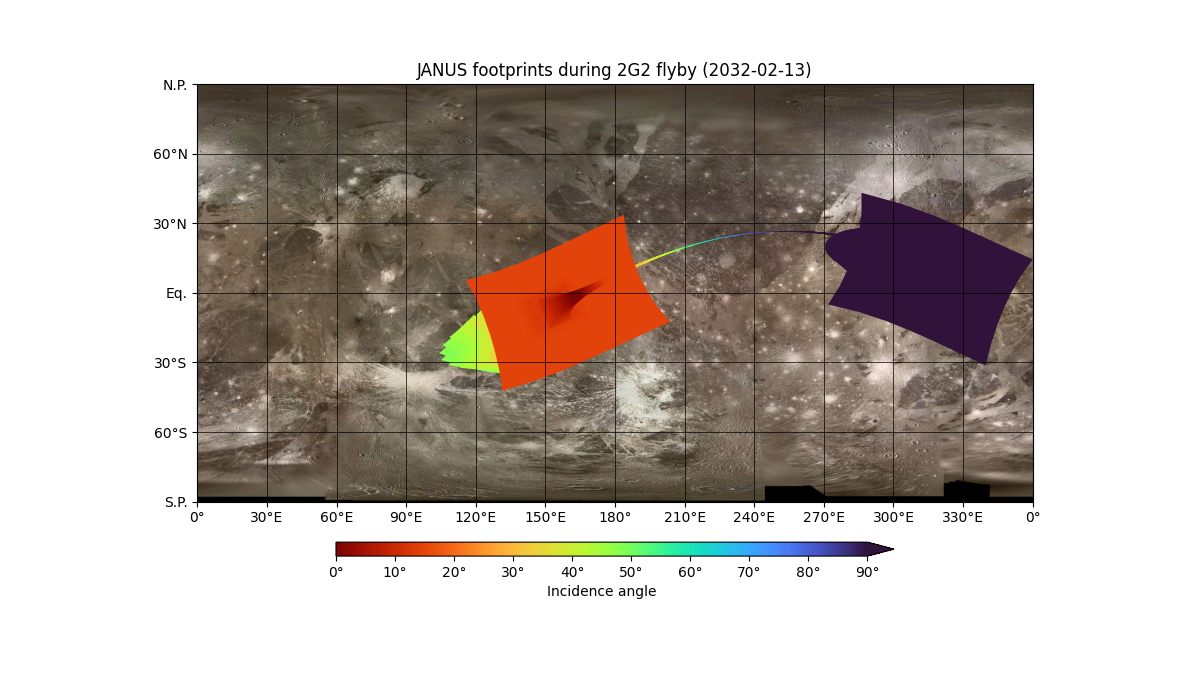
JANUS FOV during Ganymede flyby#
Example of representation of JANUS field of view during 2G2 Ganymede flyby.
import matplotlib.pyplot as plt

from planetary_coverage import GANYMEDE, TourConfig
Load Juice flyby trajectory during 2G2#
tour = TourConfig(mk='5.1 150lb_23_1', version='v422_20230130_002',
                  spacecraft='JUICE', instrument='JANUS', target='Ganymede')

flyby = tour.flyby('2G2')

flyby
<InstrumentFlyby> Observer: JUICE_JANUS | Target: GANYMEDE
 - Altitude at CA: 400.0 km
 - UTC at CA: 2032-02-13T23:03:55
 - Duration: 1 day, 0:00:00
 - Nb of pts: 2,041
Keep only the part of the trajectory below 100,000 km#
mask_flyby = flyby.where(flyby.alt < 100_000)

mask_flyby
<MaskedInstrumentTrajectory> Observer: JUICE_JANUS | Target: GANYMEDE
 - First UTC start time: 2032-02-13T18:23:55.000
 - Last UTC stop time: 2032-02-14T03:43:55.000
 - Nb of pts: 1,953 (+88 masked)
 - Nb of segments: 1
Represent JANUS FOV on the map#
fig = plt.figure(figsize=(12, 7))
ax = fig.add_subplot(projection=GANYMEDE)

ax.add_collection(mask_flyby.fovs(facecolors='inc',
                                  vmin=0, vmax=90, sort='inc'))

ax.colorbar(vmin=0, vmax=90, label='inc', extend='max')

ax.set_title(f'JANUS footprints during 2G2 flyby ({flyby.date_ca})')

plt.show()
Download
Total running time of the script: ( 0 minutes 5.625 seconds)