Flyby properties#
Search for the closest approach point#
The location of the closest approach (CA) point is always computed internally to ensure that the flyby is correctly centered on its lowest altitude with a resolution of 1 sec.
To ensure great performance, the CA location search is performed in a 3-step process:
1st step with a coarse resolution (20 min at CA ± 12h)
2nd step with a medium resolution (1 min at CA ± 30 min)
3rd step with a fine resolution (1 sec at CA ± 2 min)
By default the final sampling temporal steps are irregular with a high resolution only around the CA:
1 pt from CA -12 h to CA -2 h every 10 min
1 pt from CA -2 h to CA -1 h every 1 min
1 pt from CA -1 h to CA -10 m every 10 sec
1 pt from CA -10 m to CA +10 m every 1 sec
1 pt from CA +10 m to CA +1 h every 10 sec
1 pt from CA +1 h to CA +2 h every 1 min
1 pt from CA +2 h to CA +12 h every 10 min
Show code cell source
fig = plt.figure(figsize=(12, 4))
ax = fig.add_subplot()
ax.plot(flyby.utc, flyby.alt, '.', color='tab:orange')
# Optional labels
ax.set_ylabel('Altitude')
ax.xaxis.set_major_formatter(date_ticks)
ax.yaxis.set_major_formatter(km_ticks)
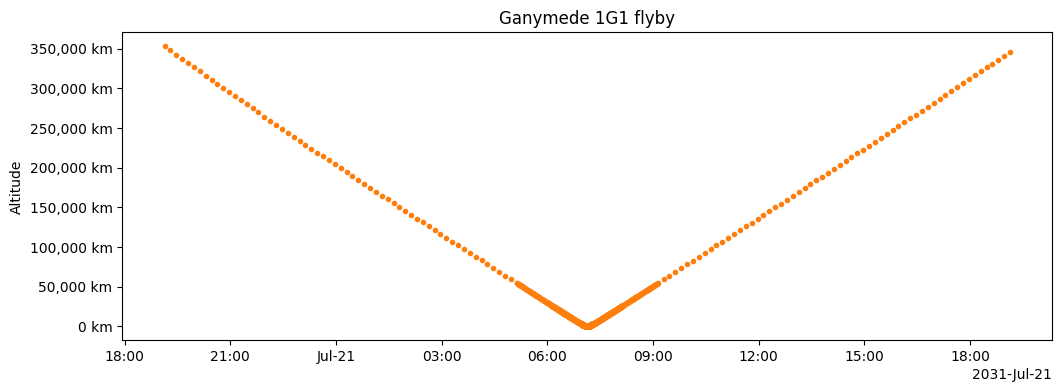
ax.set_title('Ganymede 1G1 flyby');
List of the available properties#
A Flyby object behaves exactly as a Trajectory object but also has additional properties:
utc_ca: the closest approach UTC time.date_ca: the closest approach date.lon_e_ca: the sub-spacecraft west longitude at closest approach.lat_ca: the sub-spacecraft latitude at closest approach.alt_ca: the altitude at closest approach (km).inc_ca: the incidence angle at closest approach (degree).emi_ca: the emission angle at closest approach (degree).phase_ca: the phase angle at closest approach (degree).pixel_scale_ca: cross-track iFOV projected on the target body at closest approach (km/pixel).t_ca: the relative time to closest approach.ca: aTrajectorywith only the closest approach point.
Represent one or more flybys on a Map#
fig = plt.figure(figsize=(12, 9))
ax = fig.add_subplot(projection=GANYMEDE)
for name, flyby in tour.get_flybys(alt_min=500).items():
ax.plot(flyby.where(flyby.alt < 20_000), 'inc',
linewidth=3, vmin=0, vmax=90, cbar=False)
ax.plot(flyby.ca, 'o', color='lightgrey')
ax.annotate(f'{name} ({flyby.date_ca})', flyby.ca.lonlat,
xytext=(0, 10), textcoords='offset points',
color='lightgrey', ha='center', va='center')
ax.colorbar(vmin=0, vmax=90, label='inc', extend='max')
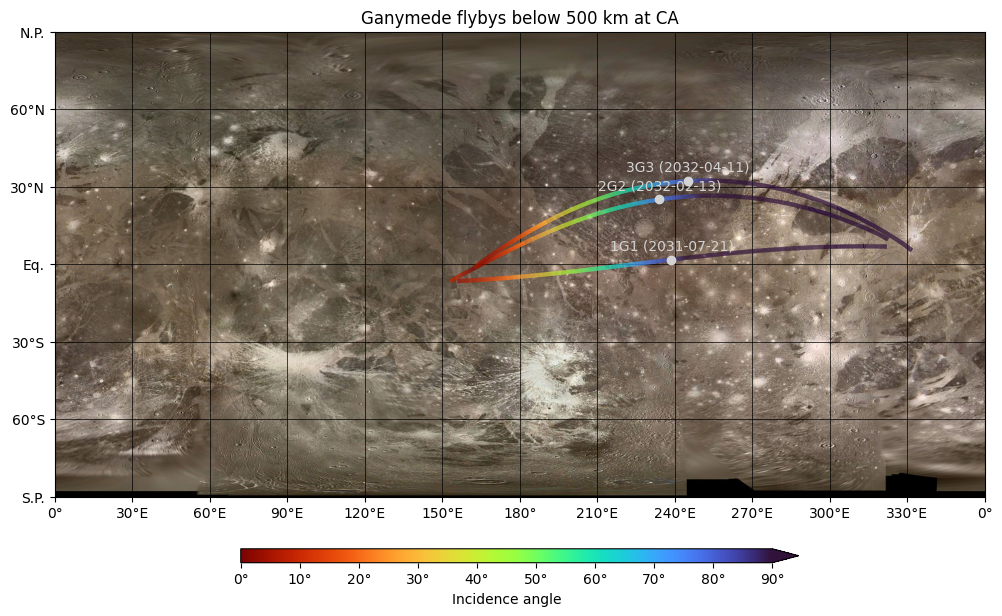
ax.set_title('Ganymede flybys below 500 km at CA');
Temporal window below a given altitude#
You can use the alt_window() function, if you need to find when the flyby is below a given altitude (km):
flyby.alt_window(20_000)
(numpy.datetime64('2032-04-11T03:13:10'),
 numpy.datetime64('2032-04-11T05:16:32'),
 datetime.timedelta(seconds=7402))
You will get, the start and stop times when these conditions are met and the duration of the window.